
|
Fluctuating market forces over the past seven decades have influenced the economic climate in which wool and meat have been produced to such an extent that production systems and sheep had to continually be modified to adapt to these changes. This lead to the development of highly efficient and functional multi-purpose sheep like the Dohne Merino that produce both meat and wool in a wide range of environments and production systems.
The influence of long term price trends on production and income of wool and meat. Although the price of wool is determined by supply and demand, it is also influenced by the price of competitors such as cotton and artificial fibers. The price is further influenced by the fact that wool is an export commodity exposed to the lower inflation rates in industrialized countries. Declining sheep numbers and rapid population growth in the RSA have lead to an increased demand and shortages in the supply of sheep meat. This, together with a relatively high inflation rate in the RSA has lead to a faster rate of increase in the price of meat relative to that of wool. |
|
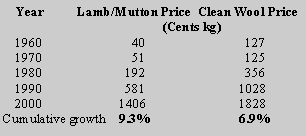
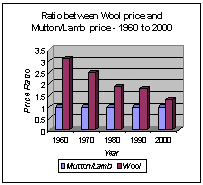
The difference in the cumulative growth between meat and wool is 2.4% per year which means that the meat price has increased 34% faster compared to that of wool if the cumulative growth of wool is used as comparison. This has reduced the price ratio between meat and wool from 1 : 3,2 in 1960 to 1 : 1,3 in 2000- Graph 1
To have maintained the same ratio as in 1960, the wool price should have risen to 4,400 cents per kg by the year 2000. At the 2000 ratios, the weight of meat produced is by far the most important factor that influences the profitability of woolled sheep flocks. Independent financial analyses show that meat/wool production systems that currently generate top margins, produce by volume, marketable commodities in the ratio of 80% meat and 20% clean wool. This means that for every 4 kg of meat, 1 kg clean wool is produced. The contribution of the meat component to total flock income when the commodity prices since 1960 are applied to a such a production system, is dramatically illustrated in Table 1, column (e). |
|
If the cumulative increase of wool income is used as a comparison, it is clear from the above illustration that the income from meat has increased 34% faster than that of wool . Nevertheless wool still has a stabilizing effect on the economy of woolled sheep farming. This is because all animals in a wool/meat production system are producing wool, even though the main objective might be to produce lambs. |
|
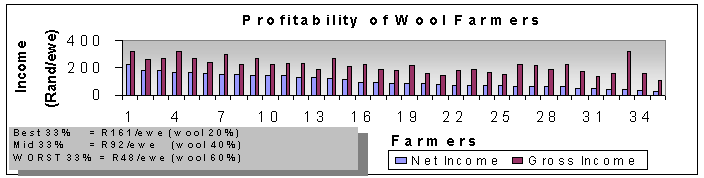
This graph depicts a profitability analysis of wool farmers in the Central Karoo and Southern Free State (Properboer). The figures demonstrate that the higher the meat income in relation to that of wool, the higher the total net flock income. |
|
Reproduction and profitability. The rapid increase in the price of meat has placed the focus on fertility. Woolled sheep flocks that achieve high lambing and weaning percentages generate high incomes. Numerous independent financial analyses of woolled sheep flocks countrywide confirm this fact- Graph 2. |
|
WOOL/MEAT PRODUCTION SYSTEM Ratio of volume marketable produce Meat : Wool 80% : 20% 8000 kg : 2000 kg |
|
(a) Year |
|
(b) Cents per Kg Meat : Wool |
|
(c) Price Ratio Meat : Wool |
|
(d) Gross Return Meat : Wool |
|
(e) Income Ratio Meat : Wool |
|
Table 1 |
|
Graph 1 |
|
Graph 2 |

|
Contact information: e-mail: manager@dohnemerino.co.za Web: www.dohnemerino.org |

|
Developed by Hazeldean Computers e-mail: stewart@hazeldean.co.za Web: www.hazeldean.co.za |

|
1960 |
40 |
: |
127 |
1 |
: |
3.1 |
3200 |
: |
2540 |
56 |
: |
44 |
|
1970 |
51 |
: |
125 |
1 |
: |
2.5 |
4080 |
: |
2500 |
62 |
: |
38 |
|
1980 |
192 |
: |
356 |
1 |
: |
1.9 |
15360 |
: |
7120 |
68 |
: |
32 |
|
1990 |
581 |
: |
1028 |
1 |
: |
1.8 |
46480 |
: |
20560 |
69 |
: |
31 |
|
2000 |
1406 |
: |
1828 |
1 |
: |
1.3 |
112480 |
: |
36560 |
75 |
: |
25 |